Development Workflows
This guide covers the development workflows for the main components of the FPGC project: how to make changes, test them, and debug issues. All commands should be run from the project root directory.
Project Setup and Full Check
Running make without arguments will automatically set up the project (create virtual environment, build the compiler, install the assembler) and run all checks:
To run all checks without setup (format check, lint, and all tests):
This is CI-safe and will exit with a non-zero status if any check fails.
Quick Reference
| Component | Test Command | Debug Command |
|---|---|---|
| Verilog (CPU) | make test-cpu |
make debug-cpu file=<test> |
| Verilog (SDRAM) | - | make sim-sdram |
| Verilog (Bootloader) | - | make sim-bootloader |
| ASMPY Assembler | make test-asmpy |
- |
| C Compiler (cproc+QBE) | make test-c |
make test-c-single file=<test> |
| Kernel (BDOS) | make compile-kernel |
make run-kernel |
| User programs | make compile-userbdos file=<name> |
make run-userbdos file=<name> |
| Host tests (libterm) | make test-host |
- |
| ASM-link tests | make test-asm-link |
- |
| CPP tests | make test-cpp |
- |
| All checks | make check |
- |
Verilog
The Verilog sources live in Hardware/FPGA/Verilog/. After writing or modifying Verilog code, it's important to run simulations to verify correctness before testing on actual hardware. I would argue that simulation is the most important part of Verilog development as logic quickly becomes too complex to validate by just looking, hardware testing takes really long and most importantly does not give insight into what is actually happening inside the design. Simulations solve all these issues and can be automated.
Simulation
For simulation iverilog and GTKWave are used to verify the design before running it on an FPGA. I like iverilog because it is fast and simple to use from command line scripts. GTKWave is a fast, simple and intuitive tool to view the resulting waveforms for debugging and verification. I specifically avoided using the integrated simulator from Quartus as these are slow, proprietary, unintuitive and way more complex than needed while being more difficult to automate (or at least have a too steep learning curve that quickly made me switch towards iverilog when I was just starting to learn Verilog).
Requires iverilog >= 12.0, as older versions do not support certain features used in the testbenches.
Running single simulations (via the make commands below) will show logs from vvp in the terminal and open GTKWave with the generated waveform and some pre-configured configuration file.
Running tests and simulations
By default, the CPU and C tests run in parallel with 4 workers to prevent crashes on machines with low RAM (<16GB), as each simulation uses quite a bit of RAM. To adjust the worker count, set the FPGC_TEST_WORKERS environment variable (e.g. export FPGC_TEST_WORKERS=12 in ~/.bashrc).
CPU tests:
Runs all assembly tests in Tests/CPU/, checking UART output. Each test executes twice: once from ROM and once from RAM/SDRAM (to exercise cache and memory controller paths).
Single CPU test:
Runs a single CPU test (both ROM and RAM) for faster iteration when working on a specific test.
Debug a CPU test:
Assembles a single CPU test, runs the simulation, and opens GTKWave for waveform inspection.
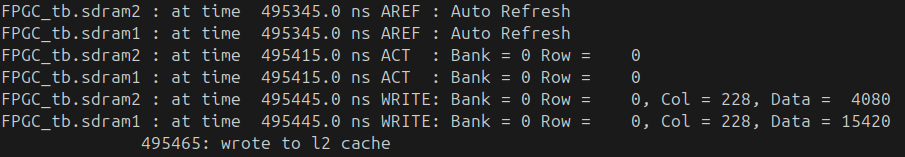
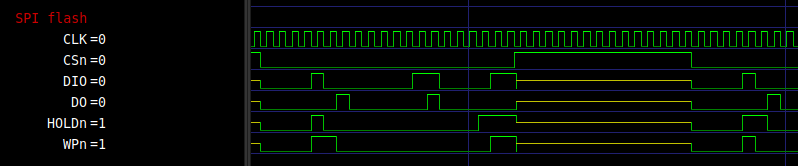
Interactive CPU simulation:
Builds Software/ASM/Simulation/sim_rom.asm (ROM), sim_ram.asm (RAM), and sim_spiflash1.asm (SPI Flash 1), runs the simulation, and opens GTKWave with preconfigured views.
Bootloader simulation:
Compiles the bootloader with --simulate and runs it in the CPU simulation.
SDRAM controller:
Runs the SDRAM controller testbench to verify timing and functionality (primarily used during initial development).
Add a CPU test:
Expectations: entry label Main, result in r15, and an ; expected=XX comment. Run with make test-cpu.
ASMPY Assembler
ASMPY (Python-based) is in BuildTools/ASMPY/.
Run tests:
Lint and checks:
After changes, it’s good to run assembler-dependent tests to see if those still pass:
C Compiler (cproc + QBE)
The primary C toolchain uses cproc (C11 frontend by Michael Forney) and QBE (SSA backend by Quentin Carbonneaux), both with custom B32P3 backends. Sources are in BuildTools/cproc/ and BuildTools/QBE/. Tests live in Tests/C/.
Build:
Both rebuild automatically when their sources change.
Run all tests:
Compiles all C tests in Tests/C/, simulates, and verifies results.
Single test:
Faster when iterating on one feature. The file path is relative to Tests/C/.
Add a C test:
Include // expected=0xXX for the return value. Run with:
Test categories:
01_*: return values02_*: variables03_*: functions04_*: control flow05_*: arithmetic06_*: comparisons07_*: logical and bitwise08_*: pointers09_*: arrays10_*: globals11_*: structs12_*: strings13_*: recursion14_*: type casts15_*: fixed-point16_*: compiler builtins17_*: register pressure18_*: spill bugs30_*: fixed-point (extended)40_*: FP64 coprocessor
Documentation
The docs use MkDocs with Material.
Serve locally:
Opens http://localhost:8088 with live reload.
Deploy:
Deploys to my personal server (requires SSH access).
Kernel (BDOS)
The kernel lives in Software/C/kernel/ with hardware drivers in Software/C/libfpgc/.
Compile:
Compile and upload via UART:
Flash to SPI flash (persistent):
After any change to files under Software/C/kernel/ or Software/C/libfpgc/, always run make compile-kernel to verify the build.
User Programs (userBDOS)
User programs live in Software/C/userBDOS/. They link against Software/C/userlib/ for syscall wrappers.
Compile a single program:
Compile all programs:
Compile, upload over Ethernet, and run:
Upload only (no run):
Debug (compile, upload, run, and capture UART output):
Host Tests
Host-side unit tests run natively on the development machine (no simulation needed).
Run all host tests:
Run libterm tests only:
Run assembler/linker regression tests:
Run C preprocessor regression tests:
FNP Deployment
FNP (FPGC Network Protocol) enables development iteration over Ethernet without reflashing.
Sync filesystem to device:
Uploads the contents of Files/BRFS-init/ to the device's filesystem.
Interactive keyboard streaming:
Run a shell command remotely:
See FNP for protocol details.
Self-Hosting
The toolchain can compile itself to run natively on the FPGC.
Cross-compile QBE and cproc for on-device use:
Stage the complete on-device C toolchain:
This lays out cc, libc-build, cached .asm files, and the compiler binaries in Files/BRFS-init/, ready to push to the device with make fnp-sync-files.
SD Card Tools
Python scripts for reading/writing the BRFS filesystem on an SD card from the host PC.
Read BRFS from SD card:
Write BRFS to SD card: